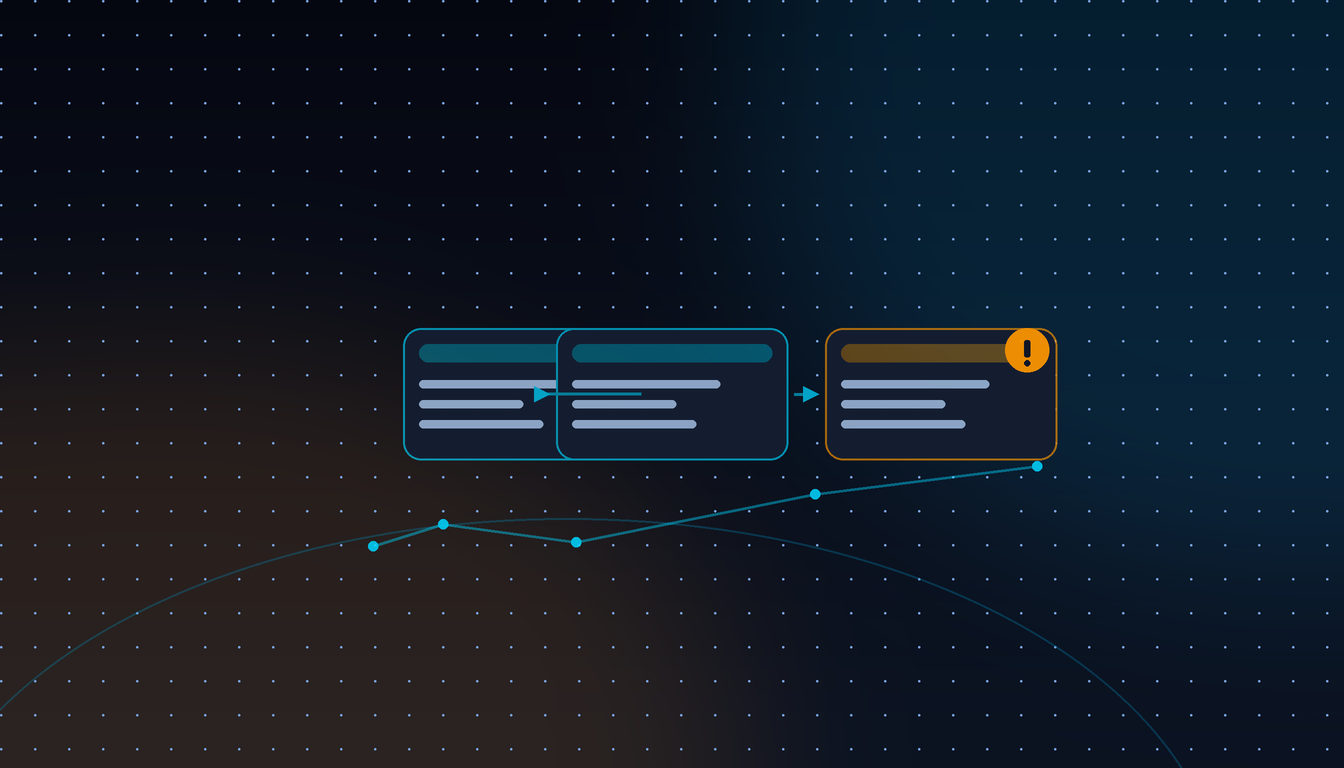

Every enterprise that has put an AI agent into production meets the same uncomfortable scene. The dashboards are clean. Latency sits inside its SLO. Error rates are flat. The on-call channel has been quiet for a week. And somewhere in the business, an agent has been quietly making worse decisions for a month.
That is not a hypothetical. It is one of the most expensive operational problems in enterprise AI right now, and it exists because the tooling most teams trust was built to answer one question: is the system running, and how fast is it responding? Agent failure asks a different question: is the system making the right decisions? A stack engineered for the first has almost nothing to say about the second, and no amount of extra tracing granularity bridges that distance.
The 71% to 11% Gap
The adoption numbers and the production numbers have never been further apart. A Kore.ai survey of enterprise teams published in early 2026 found that 71% of organizations use AI agents in some capacity, while only 11% have reached full production deployment. Gartner expects more than 40% of agentic AI projects to be cancelled by 2027.
It is tempting to read those figures as a technology that is not ready. Practitioners who have shipped agents read them differently. The demos work, the production deployments do not, and the reason sits in the middle. Agents break in ways that are hard to diagnose, hard to reproduce, and hard to explain to a stakeholder who is staring at a green dashboard.
Reliability Does Not Survive the Chain
A single agent step that succeeds 95% of the time sounds like a passing grade. Chain ten of them together and the compound arithmetic turns ugly.
Dynatrace CTO Bernd Greifeneder showed the math at Perform 2026: an agent running at 95% accuracy per step lands near 60% by step ten. Most production agent workflows chain five to twelve steps, which puts a well-tested agent at 54% to 77% success end to end. None of this shows up in a benchmark, because benchmarks test steps in isolation. Production chains them together under rate-limited APIs, variable network latency, and input distributions that match nobody's test set.
Reliability erodes along three axes, and each one needs a different fix. Tool reliability is where API errors, rate limits, and upstream schema changes land. Maxim's production analysis found that tool calling fails somewhere between 3% and 15% of the time, and that tool selection accuracy drops sharply once an agent has more than about seven tools to choose from. Model reliability is a separate problem: the same prompt returns different tool call sequences across runs as temperature, model versions, and context saturation shift underneath you. One practitioner on r/AI_Agents spent two weeks chasing a bug that only appeared once the context window passed 80% capacity and the model started dropping tool parameters. Infrastructure reliability is the third. State persistence between steps, memory management, and cleanup after a failed run are the usual suspects. A pattern that recurs constantly is the agent that fails at step six, retries from step one, and re-issues the database writes and API calls from the first five steps, because nothing in the pipeline was idempotent. The retry duplicates its own side effects.
Teams that treat reliability as one problem pick one remediation and then cannot explain why two of the three failure modes keep happening.
- Tool reliability needs retry logic, circuit breakers, and a hard cap on how many tools a single agent can choose from.
- Model reliability needs constrained outputs, tighter prompts, and validation at every step boundary.
- Infrastructure reliability needs idempotent operations and transactional state so a retry cannot duplicate its own side effects.
The Failure That Never Trips an Alert
The most expensive agent failures are not infrastructure failures. They are decision failures, and the standard monitoring stack carries no signal for them.
Take drift. An agent that scored well in evaluation degrades as the world moves underneath it. Customer behavior shifts the input distribution. An upstream data source gets reformatted. A model provider silently updates the version behind an API endpoint you do not control. The retrieved context that grounded good answers in March is stale by September. Nothing throws an error. The agent responds on time with well-formed output and is simply, gradually wrong, slowly enough that no static threshold trips.
Then there is scope creep. An agent validated for order-status questions starts fielding billing disputes. A summarization agent gets wired into a workflow where its output now triggers an automated action. Every individual call returns successfully, so the system reports full health. Nobody verified the agent's judgment for the new job, and no health check encodes where the original boundary was, so the expansion stays invisible until something goes wrong downstream. The blast radius grows while the dashboard stays green.
Decision-quality failure is the mode that exposes how badly uptime thinking maps onto agents. The agent returns a fluent, confident, on-time answer that happens to be wrong: a flawed reasoning chain, a hallucinated figure stated with total assurance, a plausible recommendation resting on a false premise. A response that is fast, available, and incorrect is byte-for-byte identical to a correct one as far as an APM tool is concerned. Clean span, healthy latency histogram, wrong answer.
These are decision failures, and they cannot be monitored as though they were infrastructure failures. Uptime asks whether the service is responding. Agent reliability asks whether it is responding correctly, inside the scope anyone actually validated, with reasoning that still holds. Different questions need different instruments.
The Monitoring Gap, in Numbers
The industry has adopted observability faster than it has adopted evaluation, and the distance between those two numbers is the whole problem.
Eighty-nine percent of teams run observability. Fifty-two percent run outcome evaluations. That leaves a band of organizations, roughly a third of them, that can see traces, latency, and error rates but have no mechanism to detect an agent confidently producing a wrong result. Their monitoring is healthy and their agents are not. As one practitioner field report put it, observability without evaluation is just logging.
What to Actually Instrument
The instrumentation layer is no longer a research project. OpenTelemetry's GenAI Semantic Conventions, run by a Special Interest Group that formed in April 2024, now define a common vocabulary for AI telemetry.
An LLM call becomes a span with gen_ai.operation.name set to chat, plus attributes for provider, requested and responding model, input tokens, output tokens, and finish reason. An agent invocation is its own span type, invoke_agent, with tool executions as execute_tool child spans and retrieval steps carrying dedicated spans as of v1.40. Prompt and completion content is captured through named events, and quality results have a defined evaluation event. Instead of every vendor inventing its own attribute names, there is now one schema your instrumentation emits and any backend can ingest. Adopt it and you can change observability vendors without re-instrumenting a single agent.
Two caveats before anyone plans around it. The GenAI and MCP conventions are still in Development status as of mid 2026, with no committed stabilization date, so attribute names can still move. OpenTelemetry ships OTEL_SEMCONV_STABILITY_OPT_IN to dual-emit legacy and new attributes through a transition, which is the pragmatic way to build on the spec today. The second caveat is adoption: Gartner put the share of GenAI deployments instrumented at all at roughly 15% in early 2026.
Instrument, Evaluate, Govern
Tracing is the foundation, not the finish line. The teams getting agent reliability right run three layers rather than one.
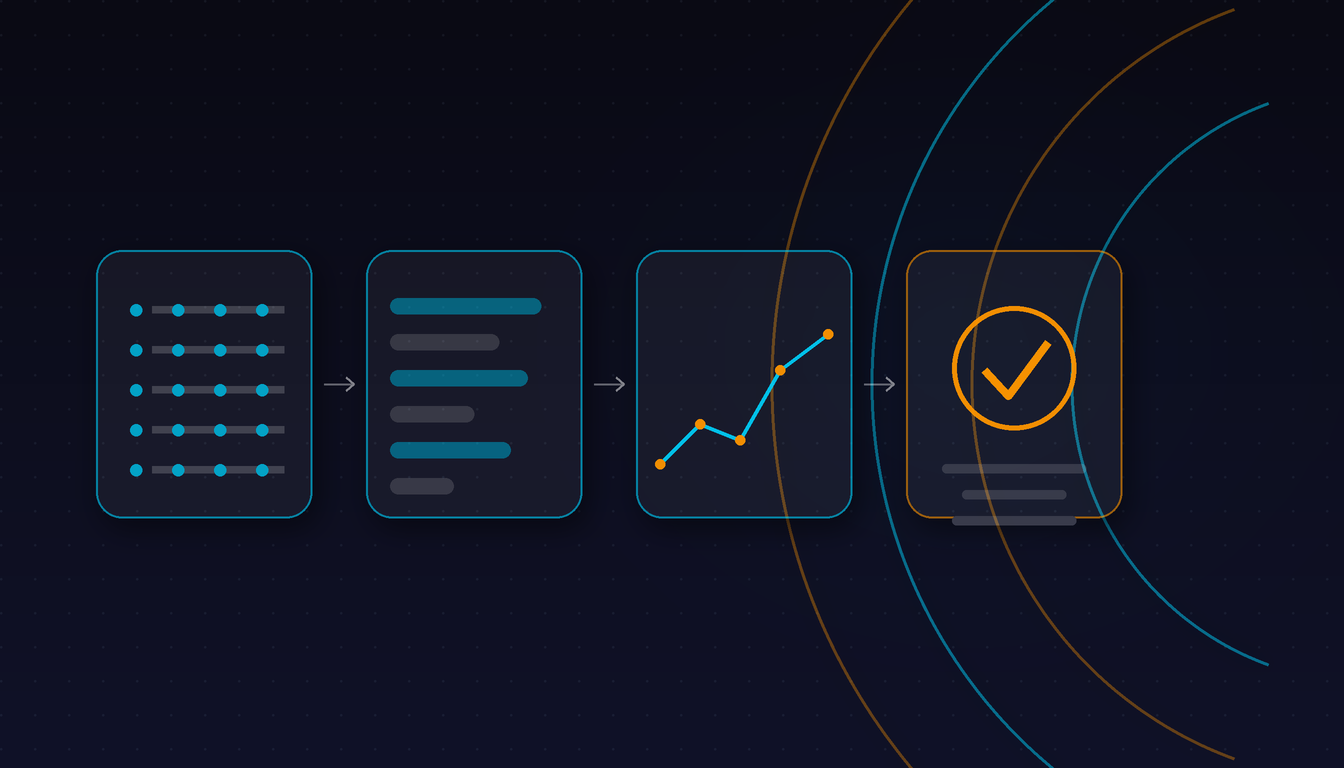
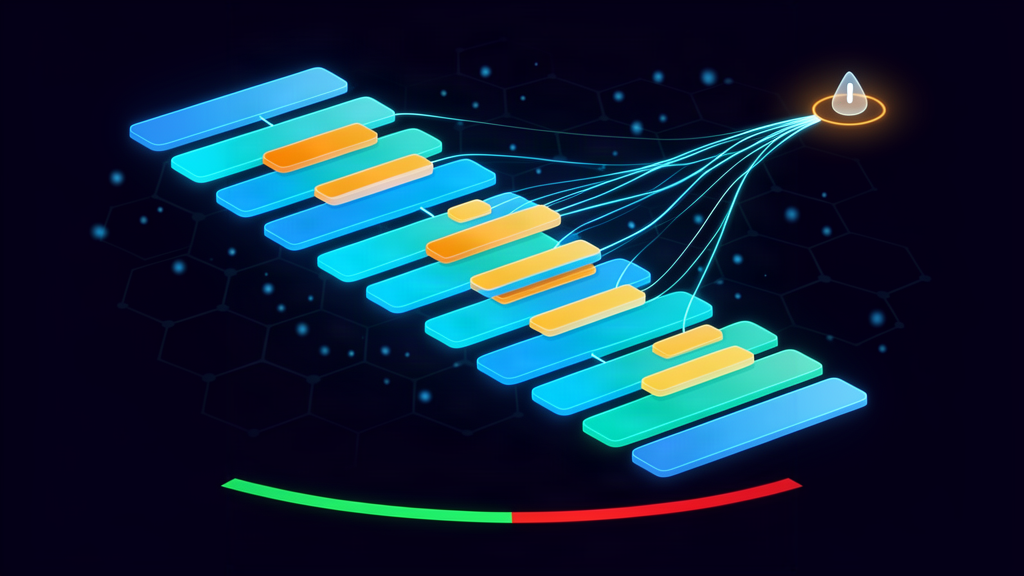
Tracing comes first. Point the standard three pillars at agent internals. Capture every run as a parent trace with child spans for each model call, tool invocation, and retrieval step, tagged with token usage, per-step latency, and provider routing decisions. Two guardrails matter here. Cap span cardinality so traces stay queryable, and make the content-capture decision deliberately. Prompts and completions often carry personal data, and OpenTelemetry provides a redact-at-collector option for exactly that reason. You can keep the full trace structure without storing raw user text.
Evaluation is second, and it is the layer most teams skip. Traces tell you what the agent said. Evals tell you whether what it said was faithful, relevant, and safe. Run them continuously against live traffic instead of in a nightly batch. Sample-based quality scoring misses the failures that matter most, the small slice of responses where drift actually surfaces, and drift detection only works if you score every production response against a defined baseline. That baseline is what you compare against when behavior changes, so version your prompts and keep the evaluation suite tied to a known-good state.
Governance is third, and it answers the questions that never fit on a Grafana panel. Can you name every agent running in production right now, including the shadow agents individual teams spun up without telling anyone? Do you know which decisions each one makes? Does each agent carry a risk classification that matches its blast radius? The governance layer holds a high-stakes agent to a higher bar than a low-stakes one and keeps an inventory that survives staff turnover.
AI FinOps, the Cost Dashboard You Are Also Missing
An observability gap costs money in two directions, and the second one lands on the finance review.
Enterprises do not run one model anymore. As of early 2026, 81% of Global 2000 companies run three or more model families, and average per-enterprise LLM spend rose from roughly $4.5M to $7M over two years. Deloitte's 2026 State of AI work found enterprises with mature AI cost governance running 40% to 60% lower per-inference costs than unmanaged deployments.
That gap is a governance gap, and it is measurable with the same telemetry you already use for reliability. Token counts and cost per inference are the unit economics, and they are sitting in your spans. Mavvrik's 2026 AI cost governance report found data platform usage overages topped the list of unexpected AI costs at 47%, just ahead of LLM token costs at 43%, which says something about how many cost sources hide outside the invoice finance is looking at. Prompt bloat is the routine offender: applications that resend redundant context, unformatted JSON schemas, and full conversational history on every request. That is a fixable engineering problem with a measurable payoff, and you can only find it if the spend is attributed per application, per model, and per team.
The 30-Day Starting Point
A practical first month does not require a platform decision.
Start by instrumenting two workflows with the OTel GenAI conventions and shipping traces to whatever backend you already run. You are not buying anything yet. You are finding out which failures you currently cannot see. In parallel, write down the decision boundaries for those two agents: what each one is validated to do, what it is not, and who owns it. Then stand up a small evaluation set against current production traffic and record the baseline score. That baseline is the asset you will be grateful for in six months, when a model provider quietly ships an update and your support deflection rate moves three points.
Agent reliability looks a lot like software reliability, which is the part most AI programs resist accepting. Trace everything, evaluate outcomes rather than availability, attribute cost honestly, and treat evaluation as a control rather than a report. None of it is exotic. All of it has to exist before the dashboard means anything, and the teams that skip it find out the hard way, usually from a customer or an auditor rather than an alert.