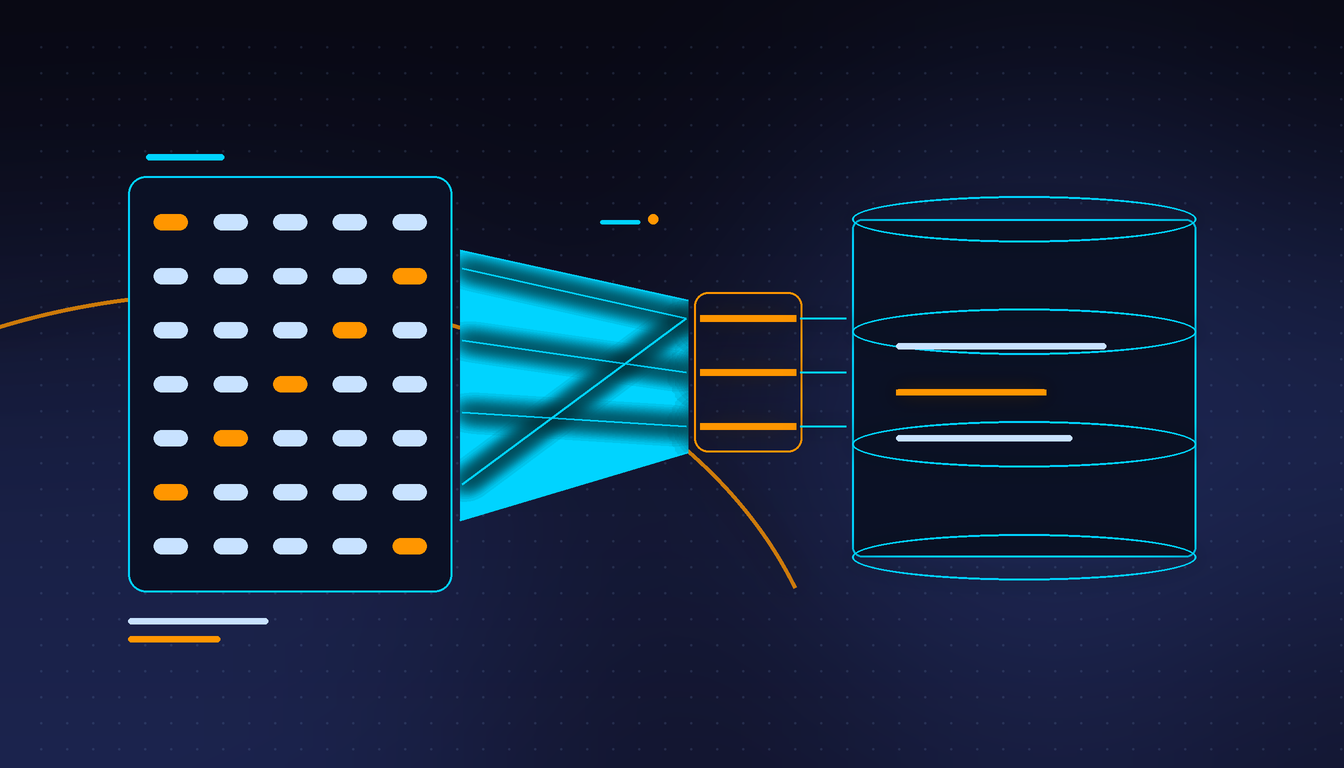


Most teams treat the production database as the sensitive system and the log platform as plumbing. That ordering is backwards in one specific way. The database holds customer records behind an application that decides what to return. The log platform holds the request bodies, the session tokens, the full URLs with password reset codes still attached, and the card numbers that failed validation. It holds all of it in plaintext, keeps it for months, and hands read access to anyone who has ever needed to debug a support ticket.
An engineer with a Kibana login can usually search every log line the company has written since January. Very few of those engineers have database credentials. The logs are the softer target, and almost nobody audits them until an incident forces the question.
How the data gets in
Nobody decides to log a password. It arrives through defaults.
A Laravel exception handler that dumps $request->all() for context will happily include the login form. A Spring service with logging.level.org.hibernate.SQL=TRACE prints every bind parameter, which on a payments table means full card data in the application log. A Node service with a Morgan format string of :method :url records the query string, and the query string is where the reset token lives. Guzzle's debug => true writes the complete request and response, headers included, to stdout. These are all one-line settings that exist because they are useful on a laptop.
Instrumentation adds a second layer. The OpenTelemetry HTTP conventions record url.full, which includes the query string, and http.request.header.authorization when header capture is enabled. Error trackers capture the last twenty console messages as breadcrumbs, so a debug line that logged a token during local development ends up attached to a production error report. Session replay tools record the DOM, and the masking that protects form fields is usually on by default and one configuration change away from off.
Then there are the logs the application never writes. An nginx access log using $request stores the entire request line, query string included. Swap it for $uri and you lose the arguments but keep the path. A CDN or WAF in front of the origin keeps its own copy, with its own retention, on someone else's infrastructure. The same request can be logged four times before it reaches your code, and each copy has a different owner.
Redacting the formatted string does not work
The instinct is to add a filter that runs a card-number regex over each log line before it ships. It catches the obvious case and misses the rest: the value that arrived URL-encoded, the nested JSON object serialized into a field, the base64 blob, the number split across two fields, the one that got truncated mid-pattern by a length cap.
Redaction has to happen on the data, before it becomes a log record. That means the logger takes a structured object, not a string, and a filter walks the object graph with an allowlist. The allowlist is the important half. Denylists of field names fail the moment somebody writes user_token instead of token, and nobody notices because the log still looks fine.
Start from the fields an operator actually needs: timestamp, service, version, environment, severity, a stable event name, a pseudonymous actor id, an outcome, a reason code from a fixed enum, a request id, a duration, a status. Everything else is optional and must be justified. A request body is almost never justified. A response body is worse.
The identifier problem needs a separate answer. Support needs to find all activity for one account, and you do not want a searchable email address in a shared index. Hash the identifier with HMAC-SHA256 and a secret held outside the log pipeline. The hash is stable, so correlation still works across services, and it is useless to anyone who reads the index without the key. Rotate the key on a schedule you can defend, and accept that you lose the ability to correlate across a rotation boundary.
What to scan for in the logs you already have
Nobody gets to start from a clean pipeline. A week of scanning the existing index is enough to size the problem, and the patterns that find real hits are not complicated.
- Digit runs of thirteen to nineteen with spaces or hyphens, then validated with a Luhn check so you are not chasing order numbers.
- The literal
eyJthat starts a base64url-encoded JWT header, plusBearerin any string field. AKIAfor long-lived AWS keys, and-----BEGINfor anything resembling a private key in a field.- Query parameters named
token,code,key,secret,password, orsiganywhere in a captured URL. - Email addresses outside the fields where you intentionally keep them.
- Fields longer than a few hundred characters, which is where serialized objects hide.
Measure the false positive rate before you turn any of it into an alert. A PAN regex without Luhn validation on a catalog that ships twelve-digit SKUs will produce thousands of hits a day, and an alert that noisy gets muted in a week. The useful output of the first scan is a count by service and field path, which tells you which team has a problem and where in the payload it lives.
Structure solves the injection problem at the same time
Plain text logs are also how log injection works. A user-supplied value containing a carriage return and a fake prefix forges a new entry. A terminal escape sequence rewrites what a reviewer sees when they tail the file. A framework that interpolates values into a message template expands ${jndi:...} or a format specifier before anyone can inspect it.
JSON encoding with bounded field lengths fixes both problems with one change. Values become values, the encoder escapes control characters, and a length cap stops a megabyte of request body from becoming a log line. Keep the message templates constant and put variable data in fields. That also makes the data queryable, which is the reason to do it in the first place.
Retention is a compliance decision, not a storage decision
If a log line contains an email address, an IP address, or a session identifier, it is personal information under PIPEDA in Canada and personal data under GDPR in Europe. That means the retention period has to be something you can explain, not whatever the index's default happened to be.
Payment environments pull in the other direction. PCI DSS 4.0 requires audit logs to be retained for at least twelve months, with the most recent three months immediately available for analysis. Requirement 10 also requires that logs be protected from modification, and Requirement 3 forbids storing sensitive authentication data at all, so the CVV that appears in a debug line is a finding regardless of how long you keep it.
The two obligations fit together once you separate the audit trail from the debug trail. Audit events are a small, fixed schema: who did what, to which resource, from where, with what result. They get a long retention, write-once storage, restricted read access, and integrity protection. Application logs are diagnostic noise with a short value half-life, and fourteen to thirty days covers nearly every investigation. Splitting the streams lets you satisfy the twelve-month requirement without keeping four hundred million request bodies around to meet it.
Access control is where the plan usually stops
A redaction pipeline that feeds one shared index still exposes everything to every engineer. Separate indices by trust boundary, at minimum keeping production from staging and payment services from everything else, and grant read access per index rather than per cluster. Turn on query auditing for the log platform itself, so searching for a customer's record is a recorded event.
The pipeline has an owner problem too. The application writes the logs, the platform team runs the collector, security owns the retention policy, and legal owns the deletion schedule. Four groups, one data flow, and no single person accountable for what ends up in it. Name an owner for the schema, give that person the authority to reject a new field, and the rest follows.
What to change this week
Turn off the debug settings that only exist for local development, everywhere, and put a check in CI that fails the build if they come back. That single change usually removes the largest volume of leaked data, because the worst offenders are the flags nobody remembered to flip.
Wrap the logger so every call goes through one function that takes structured fields and applies the allowlist. One function is enforceable. A convention is not.
Rewrite the proxy log formats to use the path without arguments, and add a rewrite rule that strips known-sensitive query parameters before they reach any log sink. Then scan thirty days of historical logs with the patterns above, and delete or tighten the retention on anything that comes back as a real hit. Deleting old logs is uncomfortable, and it is the cheapest way to reduce the blast radius of a leak that has already happened.
Finally, test the redaction the way you test anything else. Push a request with a known token through staging, confirm the token does not appear in any index, and add that test to the pipeline. The failure mode of a redaction filter is silence: it keeps producing logs, they keep looking normal, and the only way to know it still works is to try to break it on purpose.
The uncomfortable part
Almost every organisation that audits its logs finds something it did not expect, and it is rarely a sophisticated attacker's fault. It is an exception handler written in a hurry, a framework default nobody read, or a query string that has been captured on every request for three years because the access log format was copied from a tutorial.
The fix is boring, which is why it gets deferred. A structured logger, an allowlist, a retention policy with an owner, and one honest scan of what is already stored. None of that is a project. All of it is the difference between a breach that costs a notification and one that costs a forensic investigation you cannot complete because the evidence was a request body nobody needed.